Missouri's State Ranking
Number of cows: 25th
Total milk production: 26th
Milk production per cow: 44th
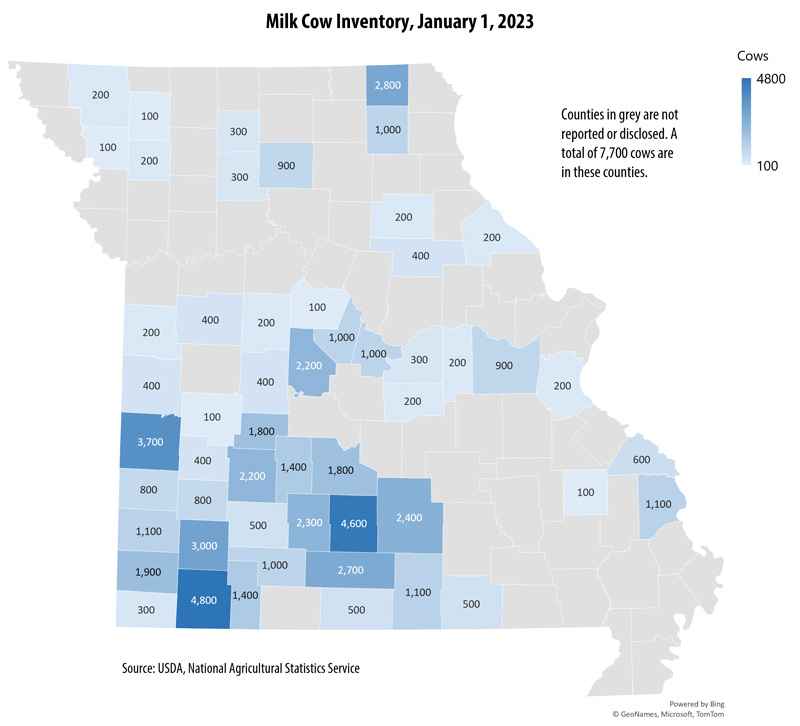
Dairy cows are located throughout Missouri. However, the Missouri milk cow population tends to concentrate in the state's southwest and south central regions. In 2022, the Missouri counties with the largest dairy cow inventories were Barry, Wright, Vernon, Lawrence and Scotland counties, though some counties were not reported by USDA to avoid disclosing data for individual operations.
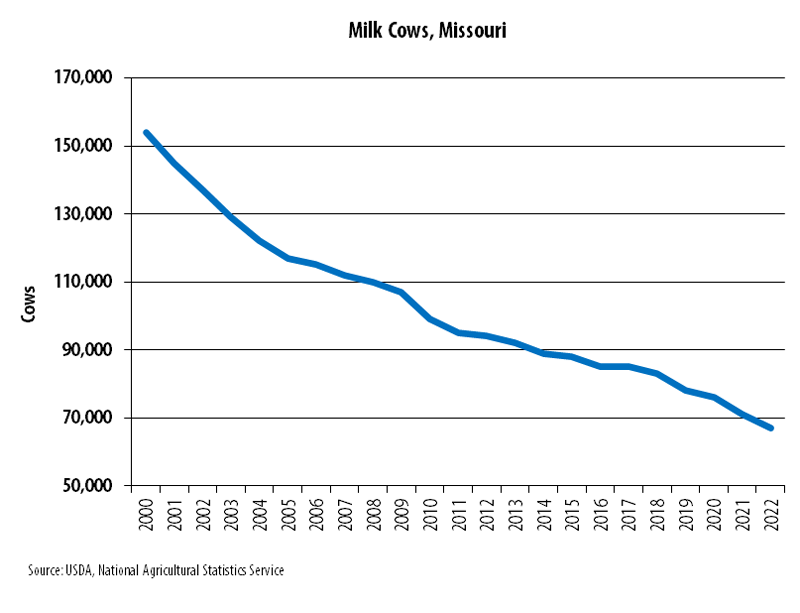
Milk Cows, Missouri
Line graph showing the number of milk cows in Missouri from 2000 to 2022. In 2000, Missouri had 154,000 dairy cows. Over time, the trend has been a decrease most years. By 2022, Missouri had 67,000 dairy cows.
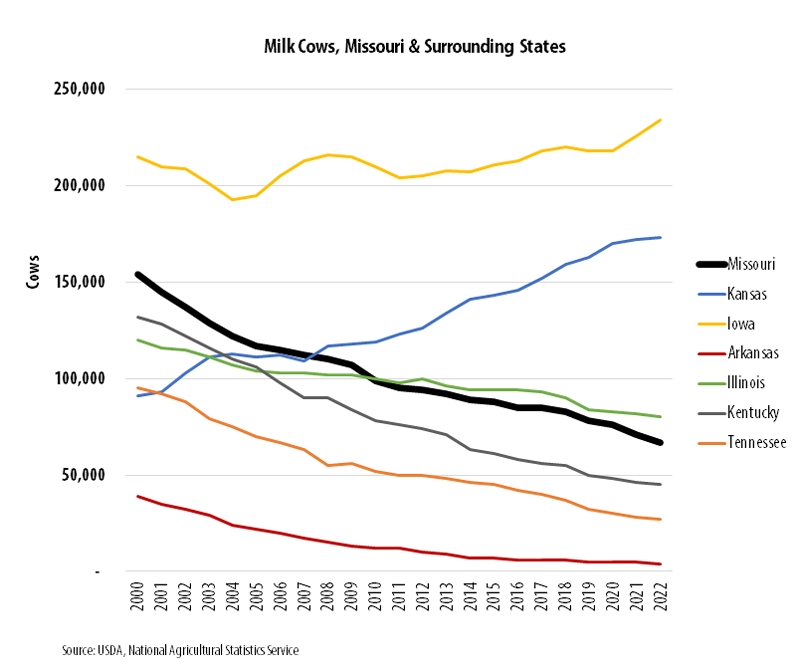
Milk Cows, Missouri and Surrounding States
Line graph showing the number of milk cows in Missouri, Kansas, Iowa, Arkansas, Illinois, Kentucky and Tennessee from 2000 to 2021. Missouri, Arkansas, Illinois, Kentucky and Tennessee have reduced their dairy cow inventories over the past two decades. Kansas and Iowa have experienced growth over the past ten years.
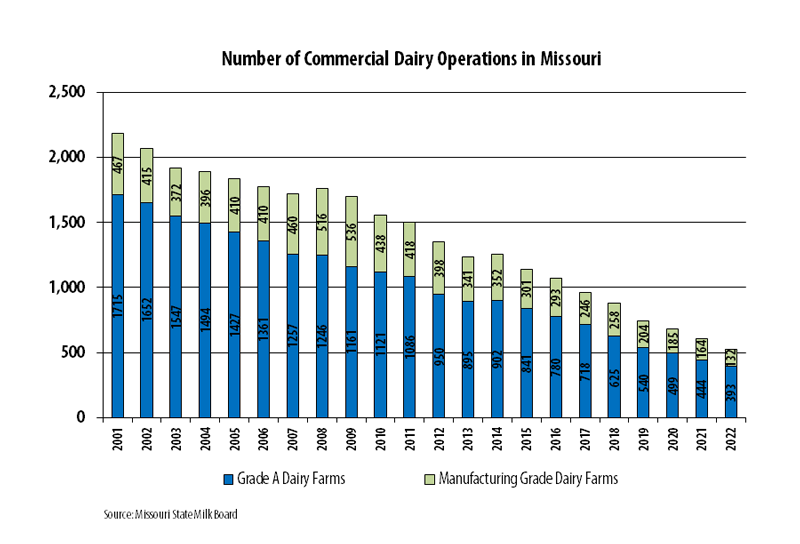
Number of Commercial Dairy Operations in Missouri
Bar chart showing number of Grade A and manufacturing grade dairies in Missouri from 2001 to 2021. The number of Missouri's dairy farms are declining slowly. In December 2001, Missouri has 2,182 permitted dairy farms. By December 2022, 525 permitted dairy farms operated in Missouri. Of these, 393 were Grade A farms, and 132 were manufacturing-grade farms.
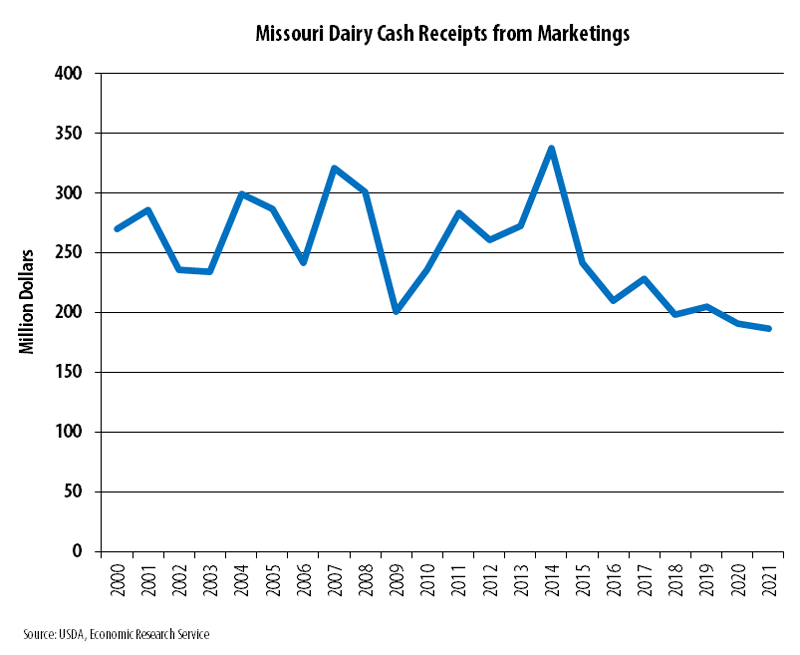
Missouri Dairy Cash Receipts
Line graph showing dollars for Missouri in milk cash receipts from 2000 to 2021. The dairy industry is an important contributor to Missouri's economy. In 2000, Missouri had $269 million in milk cash receipts. Missouri's dairy industry generated $186 million in milk cash receipts in 2021.
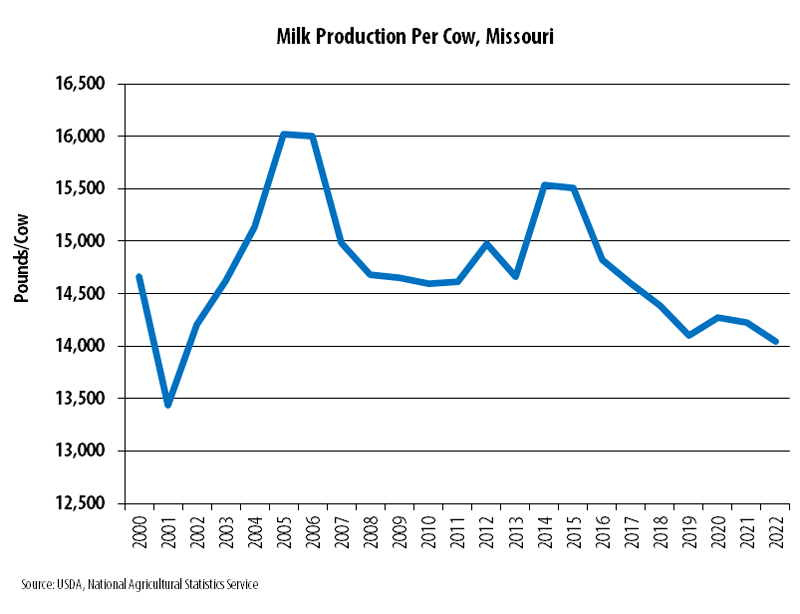
Milk Production per Cow, Missouri
Line graph showing milk production per cow for Missouri from 2000 to 2022. Missouri averaged 14,045 pounds per cow in 2022. Production per cow ranged from 16,026 to 13,441 pounds over the time period. Missouri’s milk production per cow has varied tremendously, due to a surge in low-input rotational grazing dairying since the year 2005.
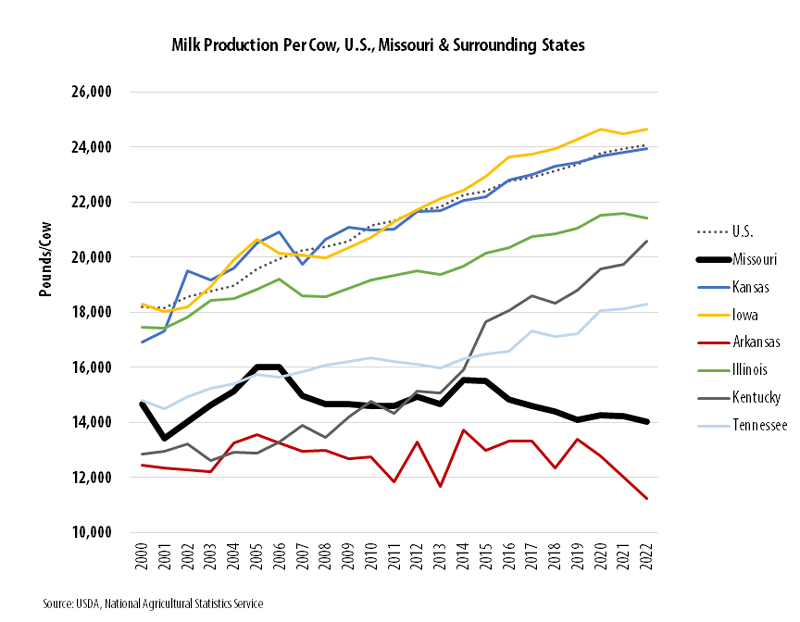
Milk Production per Cow, Missouri and Surrounding States
Line graph showing the milk production (pounds) per cow in Missouri, Kansas, Iowa, Arkansas, Illinois, Kentucky and Tennessee from 2000 to 2022. Missouri’s milk production per cow tends to be low when compared to the U.S. states. The U.S. average, Iowa, Kansas and Illinois are the highest among selected states and have steadily grown over time. Kentucky has grown considerably since 2013 and sits in the middle range along with Tennessee. Arkansas has mostly remained the lowest over the time period, below Missouri’s average.